Dashboard
Welcome to the Dashboard Page
Overview
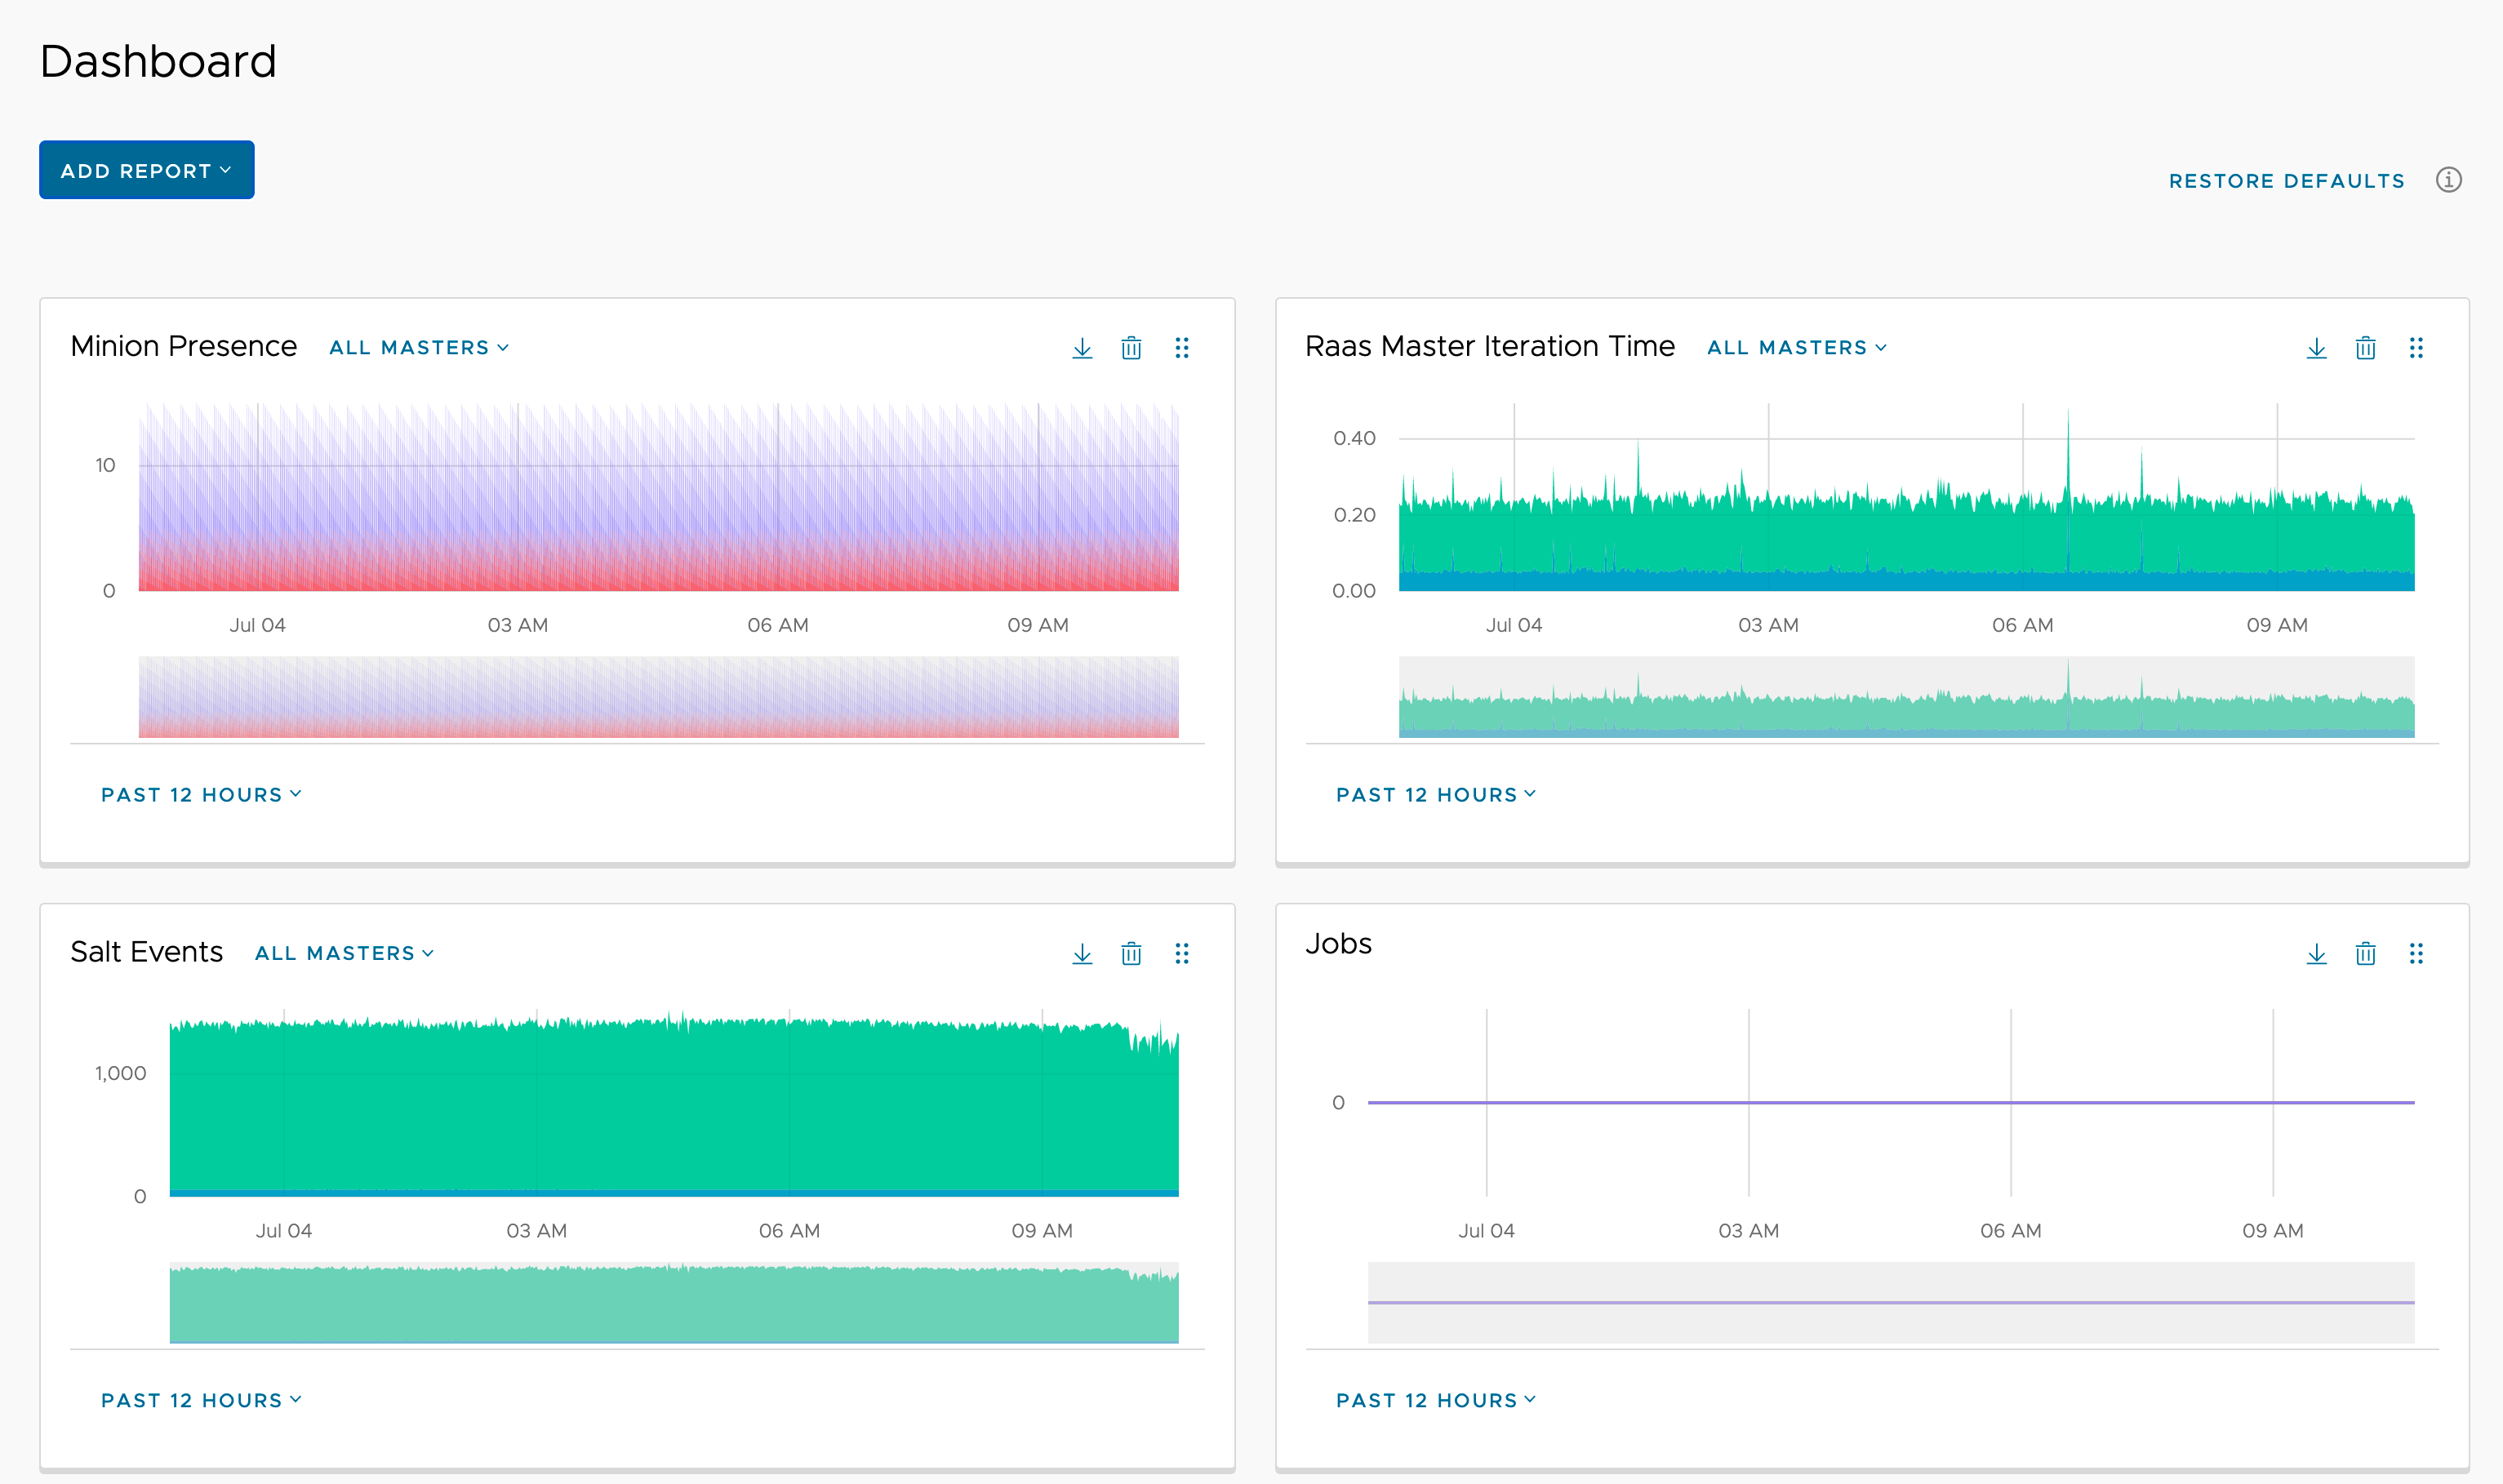
This topic explains how to use the Dashboard workspace. The Dashboard can visualize various kinds of system metrics and network data. Using the Dashboard, you can display reports (charts and graphs) of the most recent system metrics that you are interested in.
The Dashboard creates visual reports using system metrics collected by the RaaS server. This data can be used for performance diagnostics and for monitoring system events. For example, RaaS collects data about event bus traffic, volume of Salt controller commands, job frequency, minion presence, etc. Some of this data can be visualized in reports on the Dashboard to get a snapshot of your system’s most recent performance.
The Dashboard is intended to provide a high-level overview of your system metrics. For that reason, the reports can only display system data from the last 24 hours or less. To get a more detailed view of your system metrics over a longer period of time, you can use the /metrics endpoint to export system metrics to third-party tools.
You can also customize which reports you see on the page by clicking the Reports dropdown and then choosing the report you want to see.
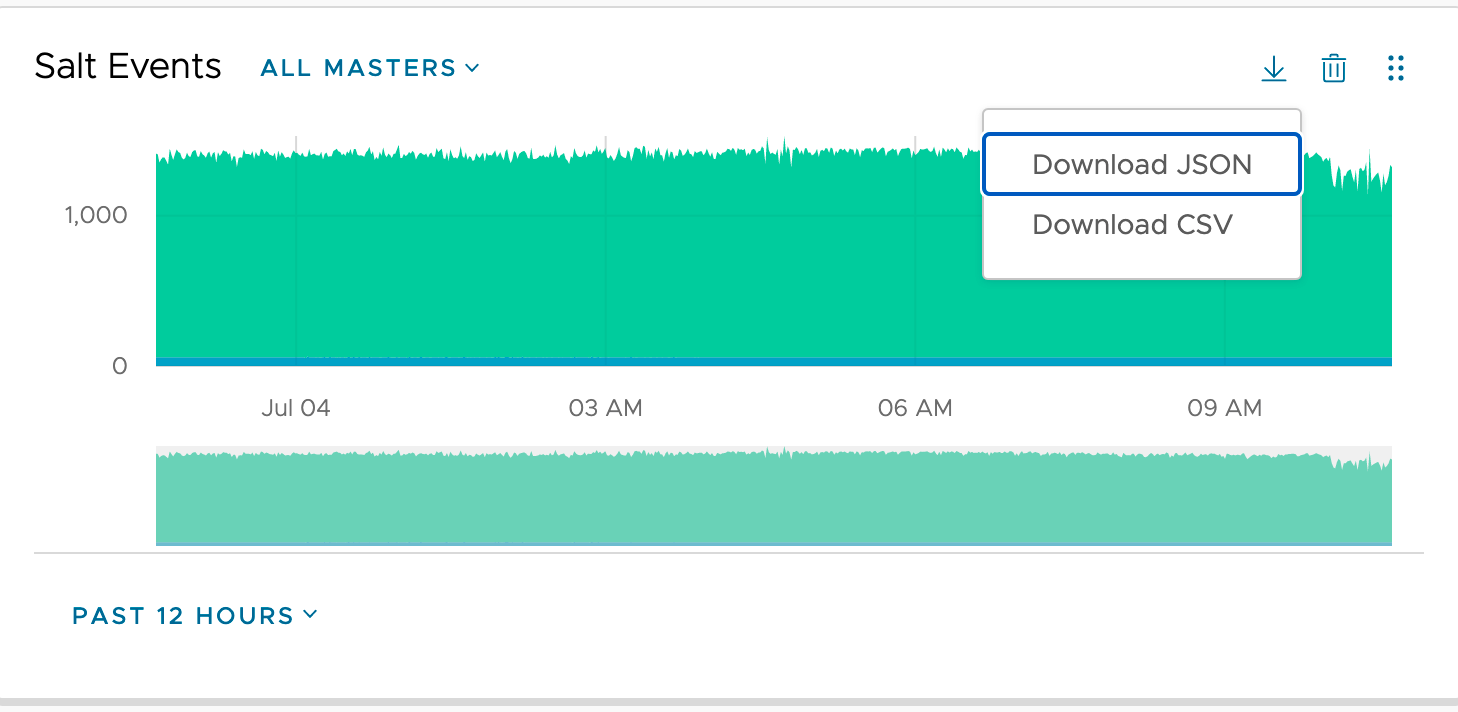
Each report can also be downloaded in a JSON or CSV format.